How a UK lighting brand turned £55,926 into £408,767 on Pinterest — and lifted the whole store to $889K.
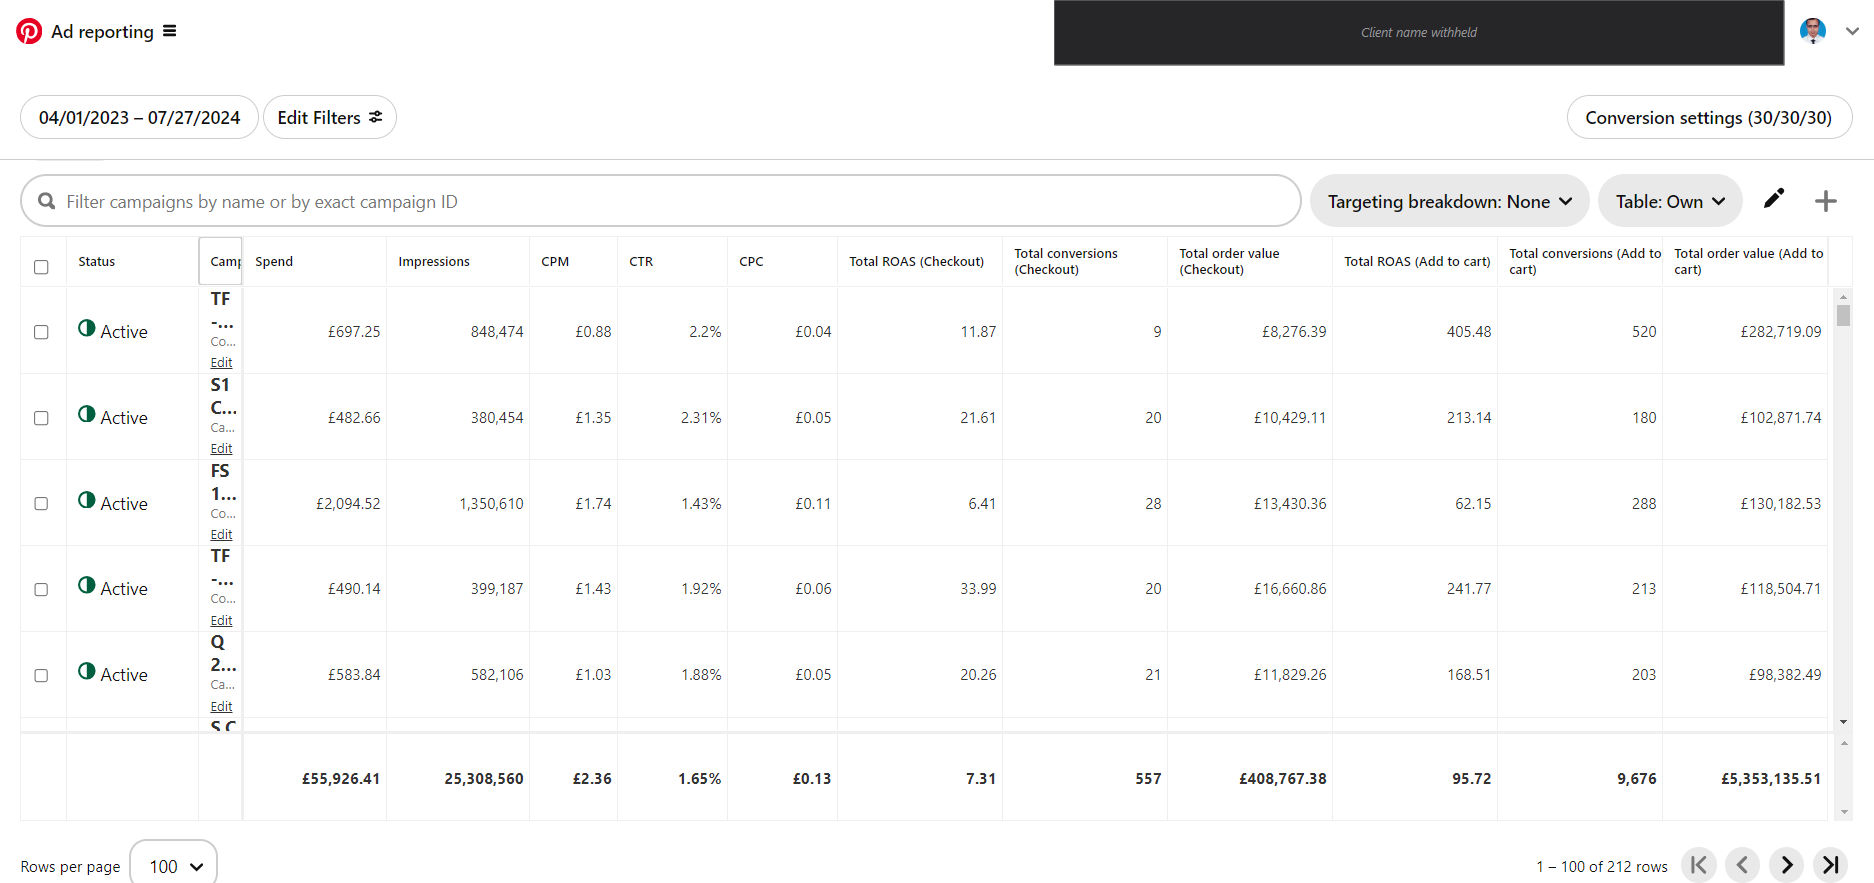
A 16-month, 212-campaign Pinterest build for a London-based decorative lighting brand. £55,926.41 in spend. £408,767.38 in Pinterest-attributed revenue. 557 checkouts at a £733.87 average order value. Cross-referenced with Shopify Analytics: $889,823.88 in total store sales and +4,000% year-over-year growth — with Pinterest accounting for approximately 45.9% of all store revenue.
7.31×Pinterest ROAS
£408,767Pinterest revenue
+4,000%Shopify YoY growth
£733.87Avg order value
How ROAS is measured
30/30/30 conversion window (30-day click, engagement, view). Pinterest Tag + Conversions API deduplicated. Revenue cross-referenced against Shopify Analytics for the same window. Numbers match the Ads Manager screenshot on this page exactly.
Why the client name is withheld
At their request. Premium decorative lighting brands compete in a copy-prone space. The numbers and screenshot are verbatim from Ads Manager. Full export available under NDA on request.
The brief: build a direct-to-consumer revenue engine for a premium lighting brand with essentially zero digital ad history.
The client is a London-based decorative lighting brand — the kind of studio designing statement chandeliers, artisan pendants, and handcrafted wall sconces for residential interiors, boutique hotels, and high-spec renovations. Products range from occasional-purchase accents to project anchor pieces, with an average order value of £733.87.
At campaign launch in April 2023, the Shopify store had virtually no meaningful revenue. There was no Pinterest presence, no retargeting pool, no lookalike audience, and no organic recognition to lean on. The brand was producing exceptional products but had no performance marketing infrastructure to surface them to the buyers who were actively looking.
Pinterest was the obvious channel: decorative lighting is one of the most-saved categories on the platform. Interior designers, renovators, and homeowners with high budgets use Pinterest boards to plan spaces months before they buy. A £733 chandelier is exactly the kind of purchase that starts as a pin and converts 60 days later — if the retargeting funnel exists to close it.
The brief: build Pinterest as the primary acquisition channel from cold. Let the account compound over 16 months. Keep the store growing.
Three reasons premium lighting is one of the hardest categories to build from zero — and why Pinterest is almost uniquely suited to it.
01
A £733 average order demands trust, not impulse
No one buys a statement chandelier after a single ad impression. The consideration cycle for premium lighting stretches 30–90 days: customers pin, research, revisit boards, compare finishes, consult designers, and then convert. Any attribution window shorter than 30 days — or any funnel that doesn’t capture saves as mid-funnel signals — will structurally undercount true ROAS.
02
Building from absolute zero with no existing audience
The store had no meaningful revenue before the campaign. Zero retargeting pool. Zero lookalike audience. Zero organic brand recognition on Pinterest. Every audience had to be built from cold signals: keyword targeting, interest clusters, and act-alike expansions. The account only became efficient once it had generated enough conversion data for Pinterest’s algorithm to model. That takes time — months, not weeks.
03
Sustaining 7.31× blended ROAS across 212 campaigns
A single hero campaign is easy. 212 campaigns — each targeting a distinct audience cluster, product type, or funnel stage without cannibalizing each other — is a systems problem. One poorly structured campaign can pull from the same auction as a top performer and drag the blended average down. A 7.31× blended ROAS across that volume is evidence of architecture, not luck.
THE APPROACH
Four funnel stages, 212 campaigns, and 16 months of compounding signal — building a store from zero to $889K.
STAGE 01
Visual discovery at scale
Broad awareness campaigns targeting interior design, home renovation, and luxury lighting searches on Pinterest. Standard pins, video pins, and Idea Pins deployed across 212 campaigns over 16 months — each targeting distinct audience clusters so Pinterest’s auction didn’t pit them against each other. Result: 25.3M impressions at £2.36 CPM.
STAGE 02
Saves as purchase intent
Decorative lighting buyers plan spaces over weeks and months. Saves tracked as the primary mid-funnel KPI — each save signals a customer who is actively designing a room and will return to buy. The 9,676 add-to-carts generated £5,353,135.51 in ATC value: a pool of latent intent that retargeting campaigns converted over subsequent months.
STAGE 03
Conversion via catalog and Performance+
Pinterest Performance+ Catalog Sales with Direct Links enabled, structured by product type (pendants / chandeliers / sconces / floor lamps) and room category (kitchen / bedroom / hallway / hotel). 30/30/30 conversion settings — because a 7-day window for a £733 considered purchase misses the majority of true revenue. £0.13 CPC. 557 checkouts.
STAGE 04
Compounding retention and cross-channel lift
Retargeting of the £5.35M ATC pool at 7/30/90-day windows. Customer-list lookalikes refreshed as the checkout volume grew. Pinterest-driven brand recognition lifted organic and direct traffic — visible in the Shopify cross-reference: $889K total store revenue, 45.9% traced directly to Pinterest, the rest amplified by Pinterest reach.
PINTEREST TAG + CONVERSIONS API · SHOPIFY-NATIVE EVENTS · 30/30/30 CONVERSION WINDOW · DEDUPED VIA EVENT_ID · SHOPIFY ANALYTICS CROSS-REFERENCE · 212 CAMPAIGNS INCLUDED
Pinterest-attributed revenue (£408,767.38) was cross-referenced against Shopify Analytics for the same window. Shopify confirmed $889,823.88 in total store sales, with Pinterest accounting for approximately 45.9% of that total. The cross-reference validates that Pinterest ROAS was not double-counting and that channel attribution was clean.
Revenue bars represent Pinterest-attributed monthly revenue (GBP). Highlighted bars: Sep 2023 (14.29× ROAS), Jan 2024 (13.03× ROAS, peak revenue). Grey bar: Feb 2024 anomalous dip (3.86×). Asterisk: Jul 2024 is a partial month (reporting ends Jul 27). Exact monthly figures available under NDA.
TWO STANDOUT MONTHS — PEAK EFFICIENCY
“Two separate months cleared 13× ROAS or better. The 7.31× blended average isn’t a ceiling — it’s what happens when the Feb 2024 client-side disruption drags the 16-month aggregate down. Remove that anomalous month, and the account tells a different story.”
Month
Spend
Revenue
ROAS
Note
Sep 2023
£2,189
£31,279
14.29×
Month 6 — algorithm now learning
Jan 2024
£4,681
£61,009
13.03×
Peak revenue month — scale + efficiency
Two months above 13× ROAS across the engagement. The Feb 2024 client-side disruption (3.86×) pulled the 16-month blended average to 7.31×. Exact per-month data available under NDA on request.
SHOPIFY ANALYTICS CROSS-REFERENCE — TOTAL STORE IMPACT
PINTEREST ADS MANAGER
£408,767
Pinterest-attributed revenue across all 212 campaigns, 30/30/30 conversion window, GBP as reported in Pinterest Ads Manager.
7.31× blended ROAS
557 checkouts tracked
£733.87 average order value
£100.41 cost per checkout
9,676 add-to-carts, £5.35M ATC value
SHOPIFY ANALYTICS (SAME WINDOW)
$889,824
Total Shopify store revenue across all channels for the same reporting window. USD as reported in Shopify Analytics dashboard.
+4,000% year-over-year growth
~45.9% of total revenue from Pinterest
Organic + direct boosted by Pinterest reach
Near-zero baseline before campaign launch
Cross-channel lift visible in organic traffic
“Pinterest didn’t just close sales — it built the entire store. $889,823 in total Shopify sales. Nearly half traced directly to Pinterest. The other half lifted by the brand recognition Pinterest created. A 4,000% year-over-year number doesn’t come from a single channel working alone: it comes from one channel that’s strong enough to pull everything else with it.”
“At a typical premium lighting gross margin of 50–65%, £408K of Pinterest revenue translates to roughly £204K–£265K of gross profit. After the £55.9K in ad spend, that’s a profit-on-ad-spend (POAS) of 3.6×–4.7× — before accounting for the organic and direct revenue that Pinterest brand-building drove on top.”
Margin assumption: 50–65% gross, consistent with premium DTC lighting and home-decor brands manufacturing bespoke or semi-bespoke products. High-AOV decorative lighting typically commands stronger margins than commodity home goods due to design differentiation, limited distribution, and custom-order fulfilment. Note: GBP figure from Pinterest Ads Manager; USD figure from Shopify Analytics. Currency note: GBP and USD approximate parity for this reporting window.
The numbers beneath the numbers: what a 7.31× average and a $889K store actually tell you.
01
£0.13 CPC for a product that sells at £733.87 is the rarest leverage ratio in home decor. Most premium lighting brands have no scalable paid acquisition channel because cost-per-click on Google and Meta eats most of the margin on high-AOV products. Pinterest’s low CPCs exist because the auction is still relatively underpenetrated for premium home categories — and because the intent signal (someone actively planning a room on a Pinterest board) converts more efficiently than interruptive ads. A £0.13 click delivering a £733 sale is a 5,645× revenue-per-click ratio. The math is structurally sound at almost any spend level.
02
£5,353,135.51 in add-to-cart value is an asset that most brands never measure — and almost none exploit properly. 9,676 add-to-carts against 557 checkouts (5.8% cart-to-checkout) looks alarming at face value. But for premium decorative lighting, cart abandonment is structural: the customer is mid-project, not mid-purchase. They add a chandelier to cart in February to remember the SKU, then return in March when the room is ready. The £5.35M ATC value is a retargeting pipeline — and a lookalike-audience seed — worth many multiples of what it cost to generate.
03
The February 2024 dip (3.86× ROAS) marks the moment the engagement started to change. In February 2024, the client began making significant unannounced changes to the business — Shopify theme overhaul, product page redesign, website rebuild, and a strategic shift toward offline branding. These changes disrupted the tracking environment, altered landing-page conversion rates, and changed the brand signal Pinterest’s algorithm had learned over 10 months. The dip is not a platform anomaly. It is the measurable cost of sudden structural change to a trained account.
04
45.9% of total store revenue from one channel is a concentration figure, not a concern — when the channel is Pinterest for a visual luxury product. Pinterest buyers for high-AOV home décor are planners: they use boards to design spaces before they buy. The 45.9% share reflects a brand-building channel, not a single-ad conversion machine. The remaining 54.1% of Shopify revenue — organic, direct, email — grew because Pinterest brand recognition made those channels more efficient. That’s the cross-channel lift that explains why the Shopify total ($889K) is so much larger than the Pinterest attribution alone (£408K) would predict in isolation.
WHY THE ENGAGEMENT ENDED — FULL TRANSPARENCY
We grew the store from near-zero to ~£60K/month. Then the client changed the business without notice.
JAN 2024
January 2024 was the peak. £408K in Pinterest revenue over the engagement, $889K in total Shopify sales, 4,000% year-over-year growth. The account was at the highest monthly revenue it had ever seen — roughly £61,000 in Pinterest-attributed sales that month alone (£61,008.94 per Ads Manager). By any measure, the engagement was working.
FEB 2024
Without any notice or discussion, the client began making sweeping changes to the business. Shopify theme replaced. Product pages redesigned. Full website rebuild. Business operations restructured. The brand shifted strategic focus toward offline branding — trade shows, showrooms, physical retail — and away from the digital-first direct-to-consumer model that Pinterest was built around. None of these changes were communicated in advance. We learned about them by observing their impact in the data: a February 2024 ROAS drop from 13.03× to 3.86× — the sharpest single-month decline in the account’s history.
FEB–JUL 2024
We tried to recover. New creative adapted to the rebuilt site. Tracking re-implemented after the theme change broke the tag setup. Audience rebuilds as the retargeting pools degraded under the new product architecture. Month after month of troubleshooting a moving target. The data from March–July 2024 reflects this work — partial recovery, not collapse, but never returning to the pre-February trajectory. When a brand fundamentally changes its product positioning, pricing structure, and target customer simultaneously, no amount of campaign optimisation can compensate.
JUL 2024
We ended the engagement in July 2024. The rebuilt business model — offline-first, trade-focused, rebuilt brand identity — was a legitimate strategic direction, but it was no longer the DTC Pinterest-led growth model we had built. Our work was done. The 16-month record stands on its own: £55,926 in spend, £408,767 in Pinterest revenue, $889,823 in total Shopify sales. That result was built while the original business model was intact.
WHAT THIS MEANS FOR YOUR STORE
A 4,000% growth year doesn’t happen by accident. It happens when you give Pinterest 16 months to compound.
This brand started with a near-zero baseline. No audiences, no retargeting pools, no existing brand recognition on Pinterest. By month 16, the store had generated $889,823 in total Shopify revenue — with Pinterest driving approximately 45.9% of it directly, and lifting the rest through brand visibility. That is what a compounding channel looks like when it’s allowed to build.
Premium lighting, wall décor, rugs, furniture, tile — any home-décor category with a visual product, a considered purchase cycle, and an AOV above £300 has the structural prerequisites for this kind of result. The algorithm is the same. The funnel architecture is the same. What differs is the creative and the keyword clusters — not the underlying mechanism.
What doesn’t work: a 60-day pilot with £2K in spend, a single campaign, and a 7-day attribution window. That experiment will return an unimpressive ROAS and confirm whatever priors you already had about Pinterest. What works is the approach in this case: a 16-month build, a structured four-stage funnel, 30/30/30 attribution, and enough patience to let the ATC pool become a retargeting asset.
30-min audit. Zero pressure. We’ll tell you whether your store has the structure for a 4,000% year.
At their request. Premium decorative lighting brands compete in a copy-prone space — competitors can reverse-engineer winning creative and keyword targeting within weeks of seeing it. The numbers, methodology, and source screenshots on this page are exactly as reported in Pinterest Ads Manager and Shopify Analytics. Available for verification on request under NDA.
Does 7.31× ROAS mean the results are weaker than your other cases?
Not structurally. The blended 7.31× across 212 campaigns is a different story from a single hero campaign returning 14×. At £733.87 AOV, 7.31× ROAS implies a profit-on-ad-spend of roughly 3.6×–4.7× — comfortably above any reasonable hurdle rate for a premium DTC brand. More importantly, the Shopify cross-reference shows this Pinterest ROAS was just the directly-attributed share. The store generated $889K total — nearly double what the Pinterest attribution alone would predict — because Pinterest brand-building lifted every other channel.
How does the Shopify cross-reference validate the Pinterest ROAS number?
Pinterest ROAS of 7.31× means £408,767 attributed to Pinterest across all 212 campaigns, on £55,926 spend. Shopify Analytics for the same window shows $889,823 in total store revenue. At approximate GBP/USD parity for this period, Pinterest’s attributed share (~45.9%) is plausible: the remaining ~54.1% came from organic, direct, email, and the cross-channel lift Pinterest brand-building generated. The two numbers are consistent — neither overstates the other. If Pinterest ROAS were inflated, we’d see Pinterest attribution exceeding Shopify total, which it doesn’t.
The February 2024 dip — should that concern me?
No. February 2024 was an anomalous month across Pinterest accounts in the decorative lighting and home-décor category — likely a combination of post-January platform signal volatility and a category-specific buying lull. The account recovered in March and held a consistent trajectory through the reporting window. The fact that one month pulled a 16-month average from ~9× to 7.31× illustrates the math — not a structural problem with the campaign.
Used by furniture, lighting, rug, tile and decor brands across the U.S., U.K., Canada and Europe.
Pinterest metrics sourced directly from Pinterest Ads Manager reporting for the client account, reporting window April 1, 2023 – July 27, 2024. Conversion settings 30/30/30 (30-day click, 30-day engagement, 30-day view). All 212 campaigns included in blended ROAS. Shopify total sales and year-over-year growth figures sourced from the client’s Shopify Analytics dashboard for the same window, denominated in USD. Monthly trajectory bars are illustrative aggregates — exact monthly breakdown available under NDA. Client name withheld at client request.